Aims
Last Saturday AREG flew another high altitude balloon for the SHSSP19 program As well as two imaging payloads using the Wenet downlink, this year we decided to measure ionising radiation during the balloon flight. Cosmic radiation levels increase as we ascend from sea level, losing the protection of our atmosphere. Cosmic rays (mainly high energy particles from our sun and beyond) and gamma rays (high energy photons) present significant hazards to humans (and electronics) in space. Our experiment was designed to repeat measurements of charged particle distribution in the atmosphere first carried out by Georg Pfotzer in the 1930s.We used two radiation detectors on the Horus-52 flight. The RD2014 solid state (SS) detector uses a set of PIN diodes (plus amplifier and limiter) that are shielded from visible light but respond to high energy photons or particles. This product has now been superseded but the manufacturer has very similar modules. A Geiger Muller tube was also used to measure ionising radiation. This requires a high voltage power supply, but fortunately uses minimal power.
Hardware
The GM schematic is a synthesis of various circuits from the web and was fairly easy to build. An oscillator drives the transistor used in the charge pump. The basic operation is easy to describe. Current starts to flow through the 10 mH inductor when the transistor is turned on. But inductors don't like sudden changes in current. The voltage across the inductor is proportional to the derivative of the current (V = L dI/dt), so when the transistor turns off we get a large voltage spike. This turns on the first diode and current flows into the high voltage capacitor. A couple more diodes and capacitors make a voltage doubler. Since the regulation of this power supply is poor, a series of zener diodes are used to stabilise the voltage (before doubling). The voltage applied to the detector is a little over 450V.The GM tube itself is filled with an inert gas and normally acts like a good insulator. However a high energy particle or photon ionises some gas molecules and initiates a discharge from anode to cathode. In our circuit this small current is amplified by a transistor and allows current to flow briefly from the (raspberry pi) 3V supply to flash a LED and drive a falling edge to an IO pin of the RPI, causing a interrupt. The solid state detector output was connected to another GPIO pin of the RPI.
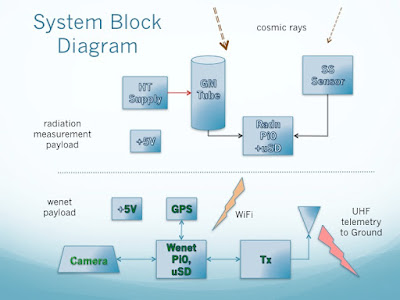
 The left hand figure shows the overall arrangement. The "radiation" payload in the upper half of the figure communicates via WiFi with the Wenet payload in the lower half. High energy particles detected by either of the sensors are counted by the radiation RPI zero. Cumulative counts are stored locally on the uSD card, and also downlinked in the Wenet telemetry stream (with the camera images).
Software
Existing Wenet code, allowed a fairly simple python script to be used on the radiation payload to count interrupts and send the current count values each few seconds via a UDP packet. The Wenet RPI was configured to act as a WiFi Access Point (AP), collecting these secondary payload packets for inclusion in the downlink telemetry within the amateur radio 70 cm band. On the ground, the secondary packets can be readily extracted and stored for real-time processing and display.The two payloads are separated by some metres on the balloon train so WiFi seemed like a good method for these boxes to communicate. We only found late in the testing that the RPI AP software was not very reliable. In addition the Wenet RPI is already heavily loaded and the AP processing can cause the processor to overhead. Some last-minute code (mainly from Mark, VK5QI) for AP suspension and restarting overcame these issues.
Results

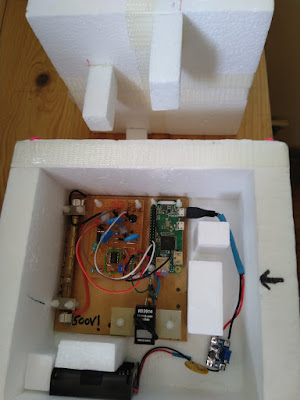
The final payload is shown on the right. From the left, the GM tube, HT supply and RPI zero are mounted on a baseboard, with the RD2014 near the bottom edge. Three Lithium AA cells provide power to a small up convertor, as the RD2014 needs to run at 5V and this also suits the RPI. All of this fits in a foam box to provide insulation.

The first figure below shows the results from data collected on the uSD card and recovered after Horus 52 had landed. The blue and green plots are cumulative radiation counts from the GM tube and SS detectors respectively. The GM tube is more sensitive (much larger number of counts), probably due to its larger area.


PostScript: RadioLab has a podcast in May 2019 on how an election count in Belgium was increased by 4096 due to a bit flip caused by cosmic ray.
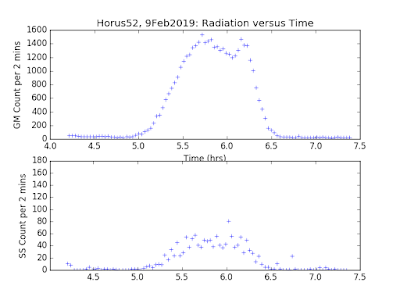
To understand the variations in radiation during the flight, the plots on the right show counts each 2 minute period. It can be seen that the radiation levels vary significantly during the flight.
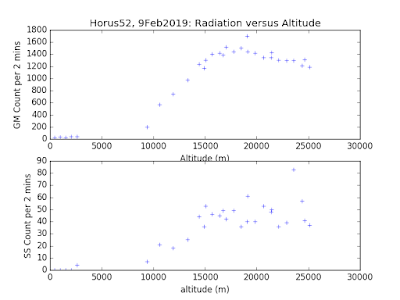
To get the best picture of radiation versus altitude we can use data collected in real-time during the flight. While the stored data in the payload didn't contain any altitude information, the ground station software stored altitude readings from the Wenet GPS, as it collected radiation data packets. This allows the radiation counts per 120 seconds to be plotted versus altitude. Now the characteristic "Pfotzer Maximum" can be seen more clearly around 15 to 20 km.